


Should you care about Tabular AI?
SOTA #7: TabPFN, CARTE, and few-shot data science


Hi, I’m Marie from Fly.vc, and I spend time at the frontier or AI and software engineering for a living.
Today we’re going to discuss one of the current “hidden” breakthrough in AI, Tabular AI, as the CoT models generated most of the noise in Q4 and Q1. Our friends o3/r1 etc will get their analysis piece, in a future article - if you want to read it, dont forget to…
Wait, what is Tabular AI? Microsoft Excel Copilot?
No, no, my friend, you’re in for something brand new and much weirder, involving the work of incredibly brilliant, GPU poor, academic teams from France and Germany.
Let’s start with a very fast recap. If you have been hiding your head in a paper bag for the past ten years, here is what you missed:
- Deep learning emerged as a thing
- It destroyed most “non-neural” approaches to computer vision
=> enabled good OCR, FaceID, self-driving cars, drones
- then it emerged for language (NLP)
=> Siri, Google Assistant, “sentiment analysis”
- Crypto-made GPUs go BRR
- GPUs + a new deep learning architecture (transformers) made NLP go BRR
=> ChatGPT, LLMs, RAG your PDF etc
[skipping the multimodal stuff video/image/voice/diffusion models/vJEPA/visual transformers/world models etc]
=> AI everywhere
… and yet, the most “rich” enterprise data source remained untouched by deep learning. What rich resource? Tabular Data: anything that sits in an Excel, or to a degree in a relational DB… in a “tabular” structure of rows and columns.

Tabular data is the realm of business analysts, data analysts, and data scientists who all have different goals and aspirations to create value from it. From simple reporting to advanced forecasts and clustering to identify patterns, from the data lakes to Sagemaker and Dataiku, an entire industry exists to help companies build value on top of this core data.
Tabular data is usually put to work to do 2 main things besides “analytics”:
predictions/forecasts: this is usually a must when it comes to things you want to do with your tabular data. How many customers will I have next month based on the trend? How many call center operators should I staff tomorrow? Will this stock price go up?
classification and clustering. What customers are likely to churn? What products fit the same consumption unit as cheap frozen pizza? What transactions are frauds? Is this item a duplicate?
Then there are more advanced machine learning topics that involve causality (risk models, pricing models etc) etc but let’s keep it simple for now.
How do you get these forecasting / classification models to work? Well, you use “machine learning”. Open source had provided data scientists incredible non-deep learning tools for years, with data science frameworks like Keras from François Chollet (13M downloads in the last month) or scikit-learn (79M downloads in the last month) which is now turned into a venture (Probabl) by repeat founder Yann Lechelle and the OG contributor team.
The status quo: Deep learning for Tabular data never worked, so nobody cared
The traditional machine learning models, notably the tree-based methods like XGBoost, have historically outperformed every single deep learning technique on tabular data. This performance gap was attributed to the complex nature of tabular data, which includes heterogeneous features and intricate relationships that deep learning models struggled to capture effectively.
When Transformers emerged near 2020 and “unlocked” NLP, a lot of focus was put on getting transformers to work on tabular data as well:
TabNet (2019, Google Cloud AI Research): An innovative deep learning model optimized for tabular data processing, TabNet employs a sequential attention mechanism to select relevant features, aiming to bridge the performance gap between deep learning and traditional methods.

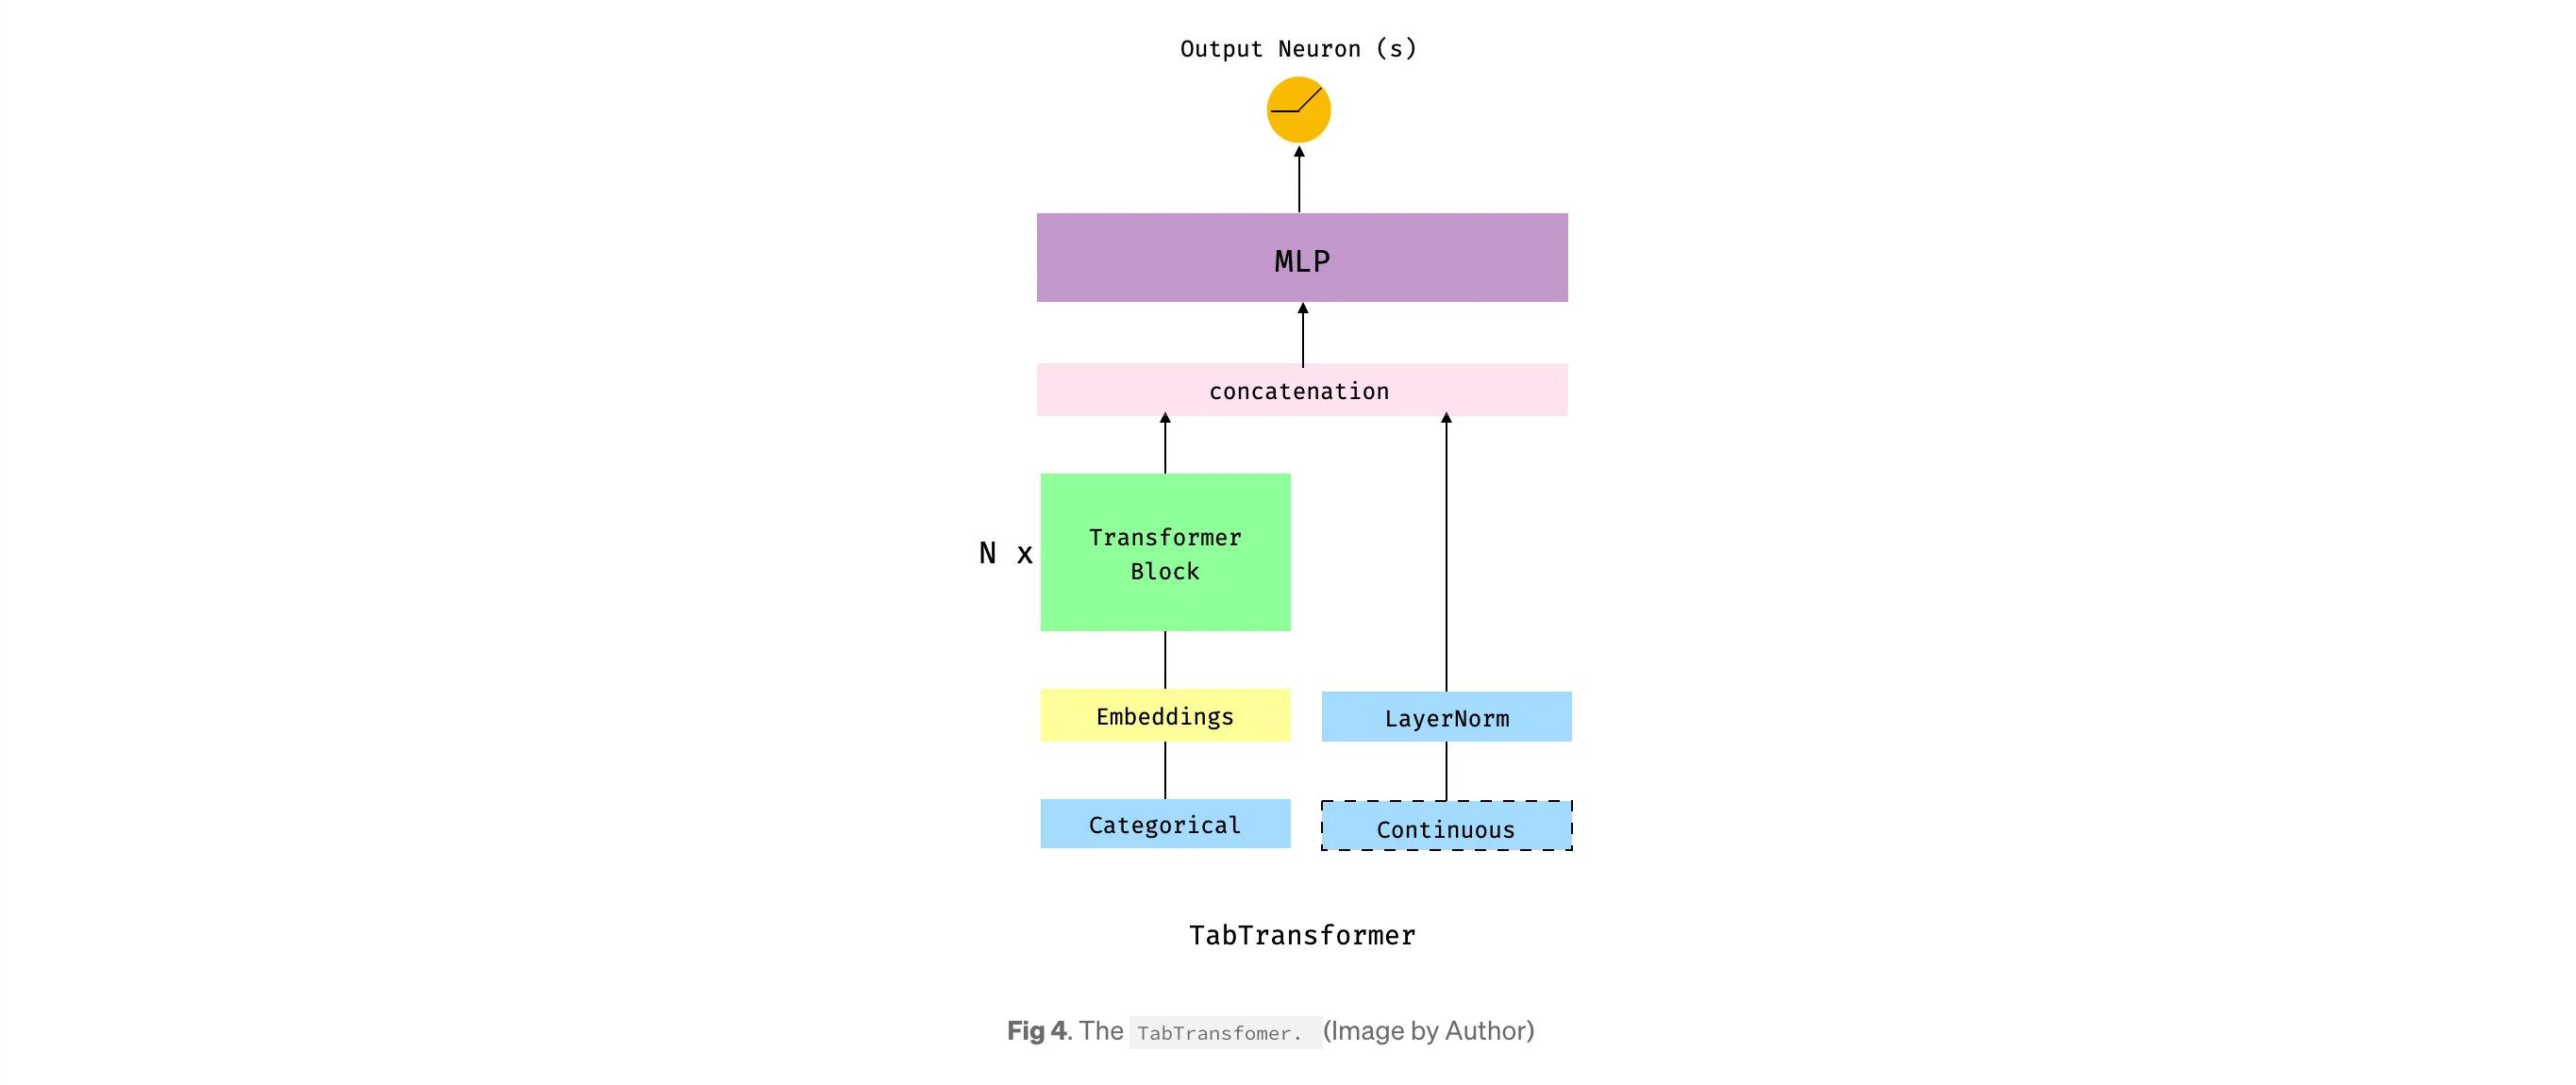
TabTransformer (2020, Amazon) leveraged self-attention mechanisms from Transformers to model tabular data.
“We exploit a successful methodology from NLP in which a model is pretrained on unlabeled data, to learn a general embedding scheme, then fine-tuned on labeled data, to learn a particular task. We find that this approach increases the accuracy of TabTransformer, too.”. TLDR it transforms embeddings of categorical features into robust contextual embeddings, aiming to achieve higher prediction accuracy. While it improved deep learning performance on tabular data, it did not surpass traditional models like XGBoost. Amazon had a history of trying to get this to work for obvious reasons (if you’re curious: history)
A ton of others followed (TabMlp, TabResNEt, …): 2020-2024 saw a Cambrian explosion in the diversity of tactics and models used.

The above chart comes from a 2023 survey who listed all the various deep learning methods for tabular data, categorizing them into data transformations, specialized architectures, and regularization models. (If you’re curious about the different approaches and how they compare, this blog post is for you.)
The survey’s most interesting conclusion was that, despite advancements, deep learning models were still not on par with traditional methods.

#sad!
2023: The breakthrough TabPFN, a transformer pre-trained with the “Plato ideal of data”
In June 2023, however, TabPFN, changed everything.
Instead of training on real-world datasets, the German ML Lab from Freiburg Uni pre-trained a transformer on millions of synthetic tables, simulating realistic data distributions. This wasn’t just encoding tricks for categorical variables but meta-learning tabular relationships from scratch.
The result? A model that makes instant, state-of-the-art predictions without retraining.
The impact was huge. TabPFN outperformed classic ML models on small datasets (⩽1000 rows, 100 features), running 230× faster than AutoML pipelines and 5700× faster with GPUs. It beat gradient boosting without tuning, and even with 50% of the training data, it matched benchmarks that took hours to compute.

The paper was replicated / expanded by many teams around the world. Researchers built on the model, extending it to time series (with mixed results), categorical data, and even self-adaptive ML pipelines.
The OG team continued to improve their work, and in Jan 2025, the team got a Nature publication, "Accurate predictions on small data with a tabular foundation model," to introduce the brand-new TabPFN v2. This version expanded the model's capabilities to handle categorical and textual features and was scaled to larger datasets, addressing the previous limitations of the 100x100 canvas. The team demonstrated that TabPFN v2 outperformed existing methods on datasets with up to 10,000 samples, achieving high accuracy with reduced computational resources. These enhancements positioned TabPFN v2 as a versatile foundation model for diverse tabular data applications
The breakthrough spawned a startup, Prior Labs, led by AutoML pioneer and Freiburg ML Lab head Prof. Frank Hutter. They quickly raised €9M to turn the open source project into a VC backed venture.

May 2024: second breakthrough, CARTE
Then, in May 2024, CARTE, a paper by Gaël Varoquaux of INRIA Saclay (France) and his team, changed the game again. Gaël and his team had already provided the world with SciKit Learn (the N°1 open source ML framework). [If you’re among the people who learned ML with fit predict, you know who to thank now!]
CARTE was a brand new approach. Instead of treating tables as disconnected numbers and categories, CARTE brings in real-world knowledge. It combines a knowledge graph (in CARTE’s case, YAGO3) with a graph-transformer model, creating a system that understands not just the data but “the meaning behind it”. This is a radical shift: rather than processing tables in isolation, CARTE taps into a network of facts—knowing that Paris is a city, that Tesla is a car company, that Diabetes is a disease—giving machine learning models a new level of context.
Most tabular AI models look at raw numbers and categories without deeper understanding. CARTE, however, turns each row into a graph:
- A table row is represented as a network: A central node (the row itself) is connected to individual cells, with labeled edges denoting relationships between column names and values.
- Text and categorical values get embedded into a vector space using a pre-trained model, capturing their meaning instead of treating them as random labels.
- A graph transformer learns how columns interact, identifying patterns across different attributes without requiring manual feature engineering (*).

This pretraining phase is CARTE’s superpower. Instead of starting from scratch on every new dataset, it “absorbs” general knowledge from YAGO3, a structured database of 18 million real-world facts. This allows CARTE to make better predictions with less data, mainly when tables contain (1) high-cardinality categorical variables, (2) sparse features, or (3) mixed data types, i.e., all the things that make the usual data science tools break.
WOW, we jumped into BIG WORDS, alright. Let me provide you with examples to make it a bit easier to connect to real life:
(1) High-cardinality categorical variables → Imagine a column in a spreadsheet for "Customer ID" or "Product Name." Instead of just a few unique values (like "Gold," "Silver," and "Bronze"), you have hundreds of thousands of unique entries. Standard models struggle with this because there’s no obvious way to group or compare them.
(2) Sparse features → Think of a sales report where most fields are empty—maybe only a few customers filled out their email, some provided their phone number, and others just gave their company name. This "Swiss cheese" data is typically horror territory for traditional ML.
(3) Mixed data types → Your data file might have numbers, dates, categories, and free-text comments all in one table. Traditional machine learning prefers formatted numbers, but real-world tabular data often contains a mix of text, dropdown selections, and numerical data—making it hard to analyze without manual cleanup.
CARTE is designed to handle this messy, “real-world tabular data” automatically, making predictions without requiring you to manually sort, clean, or convert everything into the perfect format.
So while an approach like TabPFN would theoretically dominate on pure numerical datasets, CARTE excels when categorical variables play a crucial role. A simple way to think about it:
If your dataset is just mainly numbers, TabPFN is your best bet.
If your dataset contains text, categories, or named entities, a CARTE based approach has the advantage.
In the paper, CARTE outperformed XGBoost and deep learning models across 51 real-world datasets, excelling on small tables (≤2,000 rows), text-heavy data (product descriptions, addresses, free-text fields), and pioneering multi-table learning, allowing it to extract insights from multiple, schema-mismatched datasets—something traditional models also struggle with.

CARTE has so far inspired two startups: Neuralk-AI, founded by former Inria Saclay PhD Alexandre Pasquiou and his co-founder Antoine Moissenot, raised $4M in early 2025 to build a Tabular Foundation model for Commerce (disclaimer: we led this one). They’re applying a CARTE-like approach to help retailers handle complex structured data.

The second startup, [REDACTED], still in stealth at the date of this post is another very strong, well-funded US & FR startup. It has also referenced CARTE in its pitch deck and plans to combine it with even more breakthrough approaches to tackle the limits of traditional ML, starting with use cases in Banking & Finance.

What else is out there?
Another interesting direction is “program search-based AutoML”, based on the technique behind AlphaProof, AlphaGeometry, or more relevantly FunSearch. Instead of manually selecting machine learning models and tuning hyperparameters, a system trained through RL to do program searches for algorithms and hyperparameters could do the entire process. According to a DeepMind researcher close to the topic I interviewed, this approach could specialize in discovering the best classical ML algorithm for any dataset, optimizing it automatically, and in the end delivering results as efficiently as deep learning models for tabular data—without using deep learning in the end model.
The upside of this idea is that most processes in the financial industry require total explainability, which models like TabPFN or Carte would not allow. This ML program Search technique, however, is LLM-powered, as the LLM provides the programs. It leverages large models to explore and refine potential solutions in a way similar to how GPT-4 generates text. Ultimately, the results are traditional ML algorithms, which are explainable.
While researching this topic, I found it interesting that very little research had been done about Tabular AI outside of Europe. Then, I went to Neurips and understood why: the US had become all about LLM and very maximalist in the most popular narratives. The only “resisting” pockets were mostly from European heritage (is it the Cartesian values or the fact that we’re dead GPU poor? We’ll never know).
De facto, Europe is becoming a hub for tabular AI research, and more labs like the Van der Schaar Lab at Cambridge want to join and push the field forward. They published a tribune arguing that tabular foundation models should be a priority in 2024, exploring how deep learning and AutoML can handle structured data more effectively.
“Wait a minute. Can’t normal LLMs work with tabular data? I’ve seen this great openAI demo…”. YEAH…no. Not well enough for it to matter. Large Language Models (LLMs) are primarily trained on vast amounts of text data, enabling them to predict and generate human-like text. However, this training does not equip them to predict tabular data, such as spreadsheets or databases, accurately.
When LLMs appear to handle such tasks, it is often because the datasets contain information they have encountered during training (“poisoned dataset”), leading them to recall the data, not predict it. This limitation stems from their design, which focuses on language understanding rather than structured data analysis. That’s why completely new architectures like TabPFN, CARTE, or an ML version of Funsearch were needed.
Why should you care?
Despite all the hype around large language models, tabular data is likely an equal or even bigger AI opportunity for the enterprise. Large language models are really cool, there is a lot to do with it in Enterprise world, and of course we’re only getting started - but tabular data AI, in the form of traditional data science / ML is currently live, deployed and critical for core business needs like predictive analytics. For the better companies that have built their business foundation around ML, being able to forecast better immediately translates into P&L gains, which cannot be said that easily about GenAI use cases.
Current tabular models, including current AutoML tools, are complex and limited in their ability to work across new data or tabular concepts, universalize, and avoid time-intensive fine-tuning. Creating any Machine Learning model requires a full team of Data scientists to train it, deploy it to production, and monitor and maintain it.
Existing AutoML solutions are not really better- primarily focused on fine-tuning existing models like XGBoost, and are not capable of building entirely new architectures that may be required to solve specific problems. Take fraud: even with the best AutoML tools and expert human data scientists, specific problems, like fraud detection with a rapidly changing distribution and a complex input, remain difficult to solve with existing solutions because it involves sparse and diverse data. Take churn prediction: most prediction models are only accurate in the low single digits.
The business precedents here are the existing AutoML tools & ML platforms: Google VertexAI, Dataiku, Datarobot, and Sagemaker, which helped solve the organizational problems posed by the emergence of Data as a department in most large enterprises and played their part with the open source frameworks in enabling an entire generation of data analysts to ramp up and become data scientists.
As the “ML platforms” replaced the “Analytics Suites” of the 2000s, we will likely face a similar revolution here. Instead of coding and clicking, we’ll get APIs who “just get it” from very little data, relying on their pretraining, or UIs that help you stitch data magically, or maybe Copilots as valuable to the data scientists as GitHub Copilot or Cursor are to the devs.

Epilogue: where data?
Our TabularAI new startups and research projects face a challenge that LLMs faced before them: getting their hands on data!
PriorLabs/TabPFN chose the synthetic data path to start, showing that this was a great way to go. True, very good Tabular data sets are by nature private, with very little out there to crawl compared to text, images, and videos. It will be interesting to see how the three (and likely upcoming more) startups will go about it.
***
On that note, I wish you a great day - if you have not done so, please consider to…
Love
Marie
ps (edit): TabPFN meets Excel from Benjamin Lalanne… *chills*
Eye opening read!
While I wonder how they created a generalized dataset for TabFN. CARTE makes a lot of sense from a model architecture perspective!
Your post motivates me to look more into tabular models now 😄
“Wait a minute. Can’t normal LLMs work with tabular data?" => On a similar note, I stumbled upon Time-LLM, a paper describing a method using LLM for Time Series Forecasting (https://arxiv.org/abs/2310.01728). The overall performance is quite good actually!
As time series can be seen as a type of tabular data (with data points collected over time), there might be some interesting work to do.
Btw, thanks for this newsletter, I enjoyed reading it!